Summary
-
In October 2026, the Federal Reserve paused rate hikes, but a rebound in inflation and higher energy prices restrained expectations for easing. The pullback in AI technology stocks, declining gold prices, and outflows from crypto ETFs jointly signaled cooling global risk appetite, as markets shifted from broad-based gains to structural divergence.
-
US spot BTC and ETH ETFs recorded net outflows of approximately $516 million and $1.607 billion, respectively. Institutional allocation demand cooled notably, with ETH facing more pronounced redemption pressure.
-
Global capital-market performance diverged, with the Nasdaq down about 5.3% and the Dow up roughly 1.7%. Markets reassessed returns on AI capex, gold fell below $4,000, and crude prices rose on geopolitical supply risks.
-
Weekly prediction-market volume exceeded $27 billion. Short-cycle Up / Down contracts became an important growth driver, with trading use cases extending further into TradFi assets such as stocks and gold.
-
Stablecoin payments accelerated their expansion into cross-border settlement and retail use cases, with Visa, Gate, and HSBC continuing to advance related applications. DTCC launched DTS, extending tokenized equities further into on-chain securities entitlements and trading use cases.
1. Macroeconomic and Market Trends
1.1 The Federal Reserve Pauses Rate Hikes as Economic Resilience and Energy-Driven Inflation Limit Scope for Easing
In October 2026, the core US macro tension shifted from active monetary tightening toward a wait-and-see policy stance in a high-rate environment. On October 28, the Federal Reserve announced that it would maintain the federal funds target range at 3.75%–4.00%, pausing its successive policy tightening. The decision passed with a 10–2 vote, with Lisa D. Cook and Beth M. Hammack favoring a further 25 bp hike. In its statement, the Fed noted that US economic activity continued to expand at a strong pace, domestic spending remained resilient, and productivity growth and capital investment were solid, but inflation remained elevated. This means that a temporary pause in rate hikes does not represent a pivot toward easing; inflation control remains an important constraint on policymaking.
Economic data further reinforced the case for the Fed to maintain high rates. The advance estimate of third-quarter GDP released by the US Bureau of Economic Analysis on October 29 showed annualized real GDP growth of 3.4%, clearly above the second quarter’s 2.2%. Investment, household consumption, and government spending all supported growth, while private domestic final purchases grew 4.9%, indicating that US domestic demand remained highly resilient. On employment, US nonfarm payrolls increased by only 29,000 in September, while the unemployment rate remained at 4.2%. Labor-market expansion slowed notably but had not stalled across the board. The divergence between growth and employment made the Fed’s policy trade-off between controlling inflation and supporting employment more complex.
Inflation remained the primary constraint on monetary policy. September CPI data released on October 14 showed that US consumer prices rose 0.6% month over month and 3.7% year over year, a clear rebound from August’s 3.4%. Gasoline prices rose 9.1% month over month and energy prices increased 5.2%, becoming key drivers of the month’s inflation rebound. Core CPI rose 0.3% month over month and 2.6% year over year, also up from August’s 2.4%. September PCE price-index data released on October 29 showed headline PCE inflation of 0.5% month over month and 3.6% year over year, while core PCE rose 0.3% month over month and 3.1% year over year. Core inflation remained clearly above the Fed’s 2% policy target, indicating that underlying price pressures had not been sufficiently contained.
Energy-supply risks further reinforced the inflation constraint. Ongoing US–Iran geopolitical conflict continued to disrupt Middle Eastern energy transport, while shipping-security concerns around the Strait of Hormuz lifted crude’s risk premium. On October 30, December Brent crude futures settled at $117.64 per barrel and WTI crude futures rose to $104.12, posting monthly gains of approximately 13.6% and 15.2%, respectively. Higher energy prices not only directly raised gasoline, transport, and manufacturing costs but also increased the possibility of renewed inflation acceleration. For the Fed, the combination of strong economic growth and rising energy prices increased the policy risks of cutting rates early.
The bond market began repricing policy expectations. The 10-year US Treasury yield fell from approximately 5.29% at end-September to 4.93% on October 30, down about 36 bps for the month and marking one of the larger monthly declines since December 2023. The decline reflected bond buying driven by the tech-stock pullback and rising safe-haven demand, but did not mean financial conditions had eased across the board. The 10-year yield remained close to 5%, long-term funding costs stayed elevated, and markets remained cautious about the future monetary-policy path.
For crypto markets, October featured greater stability at the policy margin but insufficient liquidity support. The Fed’s pause eased the immediate pressure from further tightening, but core PCE above target, rising oil prices, and strong economic growth made it difficult for markets to establish a clear rate-cut trade. Meanwhile, US spot BTC and ETH ETFs both recorded monthly net outflows, indicating that temporary policy stability did not immediately translate into institutional allocation demand. Risk-asset pricing gradually shifted from focusing solely on Fed rate decisions toward assessing the quality of economic growth, corporate earnings, energy costs, and financial-market liquidity together.
Overall, the US macro environment shifted from September’s active rate hikes to a wait-and-see policy stance under high rates in October. Faster third-quarter GDP growth, renewed inflation increases, and higher energy prices collectively limited the Fed’s scope for easing. Although the 10-year US Treasury yield declined, it remained elevated. For crypto markets, temporary rate-policy stability provided some cushioning, but ETF outflows and risk-asset valuation adjustments indicated that markets had yet to receive sufficient macro liquidity support.
1.2 BTC and ETH ETFs Both Turn to Net Outflows as Institutional Allocation Demand Cools Notably
From an ETF-flow perspective, US spot crypto ETFs faced clear redemption pressure in October 2026, with both BTC and ETH shifting from September’s net inflows to net outflows. US spot BTC ETFs recorded approximately $515.9 million in cumulative net outflows during October, while ETH ETFs saw roughly $1.6072 billion, bringing combined net outflows to about $2.1231 billion. Compared with September net inflows of approximately $2.648 billion for BTC and $831 million for ETH, the direction of institutional allocations reversed clearly. ETH ETF redemptions were roughly 3.1 times those of BTC, indicating that as risk appetite declined, institutions further reduced allocations to higher-beta assets.
In terms of timing, BTC ETF flows showed clear swings across different phases of the month. In early October, BTC ETFs retained some capacity to attract capital, recording approximately $102.7 million and $189.9 million in net inflows on October 1 and 2, respectively. Flows subsequently became more cautious, with consecutive net outflows from the 5th to the 8th. Single-day net outflows on the 7th reached roughly $484.9 million, marking an important outflow phase during the month. BTC ETFs returned to net inflows of about $175.7 million on the 13th, but saw approximately $261.4 million in net outflows on the 14th, indicating that institutional allocation behavior remained uneven.
In the latter part of October, BTC ETFs saw a clear round of returning capital. Three consecutive trading days of net inflows from the 19th to the 21st reached approximately $526.7 million, $23.2 million, and $524.8 million, respectively, totaling roughly $1.0747 billion over three days. The recovery did not persist, however. Single-day net outflows reached about $635.6 million on the 22nd, followed by a further $137.9 million on the 23rd. Flows turned positive again from the 26th to the 29th, but approximately $643.2 million flowed out on the 30th, the largest single-day outflow of the month. The monthly result ultimately turned to net outflows, reflecting that institutional allocation demand remained affected by market volatility and macro uncertainty.
ETH ETF performance was comparatively weaker, with monthly outflows clearly exceeding those of BTC. ETH ETFs recorded net outflows on most trading days in October, with cumulative net outflows exceeding $600 million from October 1 to 9. A brief return to approximately $24.8 million in net inflows on the 13th was followed by renewed weakness. From the 19th to the 23rd, ETH ETFs saw cumulative net outflows of roughly $220.7 million, including about $110.6 million on the 22nd. From the 26th to the 30th, ETH ETFs recorded five consecutive trading days of net outflows totaling approximately $431 million. Monthly ETH ETF net outflows ultimately reached about $1.6072 billion, roughly 3.1 times those of BTC ETFs, indicating greater pressure on institutional allocation demand for ETH.
In terms of flow structure, October’s ETF redemptions did not involve simultaneous outflows from all products. Some BTC funds still attracted net inflows, but redemptions from large funds offset the new capital. ETH ETFs also saw divergence between products, although aggregate net redemptions were more pronounced. Institutions did not fully exit crypto markets; rather, allocations diverged clearly across assets and products, with capital more inclined to reduce overall risk exposure while prioritizing the retention of more liquid core allocations.
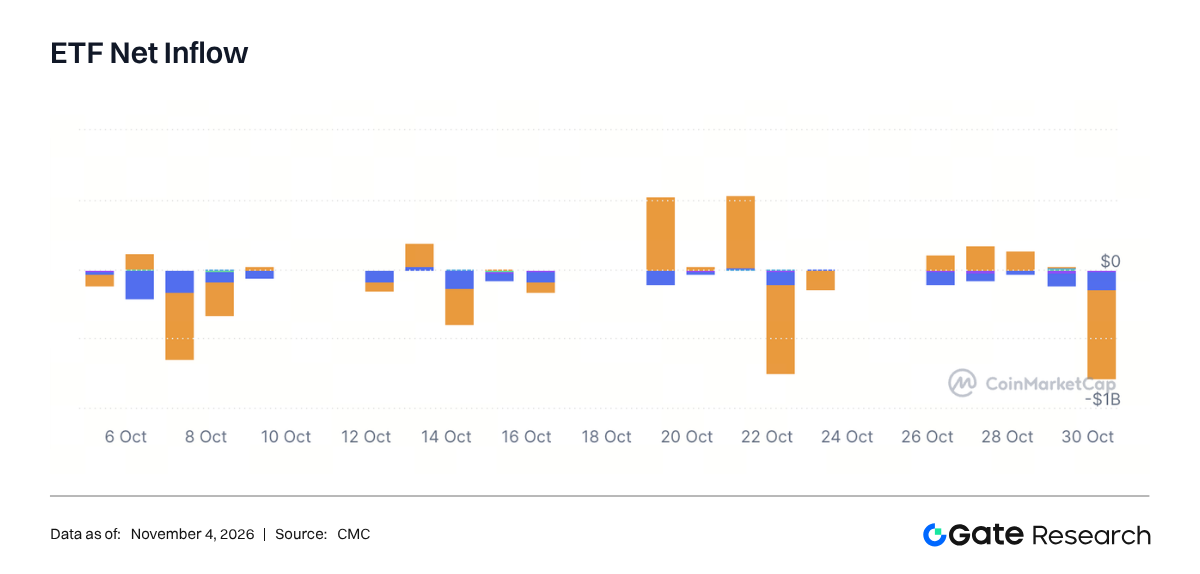
Overall, the ETF market shifted from September’s returning institutional capital to concentrated redemptions in October. BTC and ETH both recorded monthly net outflows, with ETH facing more pronounced flow pressure. Although capital was replenished temporarily around midmonth, large month-end redemptions reinforced the market’s defensive allocation stance. For crypto markets, ETFs remained an important indicator of traditional financial institutions’ capital participation, but October’s performance showed that the Fed’s pause was insufficient to drive sustained increases in institutional allocations. Flows remained jointly affected by asset-price volatility, inflation expectations, and overall risk appetite.
1.3 Global Capital-Market Trends
1.3.1 Global Risk Assets: Tech Pullback Weighs on US Equities as Traditional and Defensive Sectors Outperform
In October 2026, global risk-asset performance diverged clearly, while US equities shifted from tech-led gains toward relative outperformance by traditional and defensive sectors. Based on closing levels from end-September to end-October, the S&P 500 fell approximately 0.9%, the Nasdaq Composite declined about 5.3%, and the Dow Jones Industrial Average rose roughly 1.7%. Unlike September’s market structure, in which AI leaders were relatively strong and technology stocks remained resilient, October focus turned to mega-cap technology’s capex returns, AI commercialization progress, and earnings guidance. Technology valuations began facing more pronounced adjustment pressure.
Market moves during the month were driven primarily by three factors: the Fed’s wait-and-see policy stance, rising energy prices, and technology companies’ earnings performance. On October 28, the Fed maintained the federal funds rate at 3.75%–4.00% but gave no clear signal of rate cuts. Meanwhile, Brent crude rose approximately 13.6% for the month, increasing concerns over corporate operating costs and inflation pressure. The high-rate environment persisted, while rising energy costs also compressed some companies’ margins, prompting markets to place greater weight on corporate cash flow and earnings delivery.
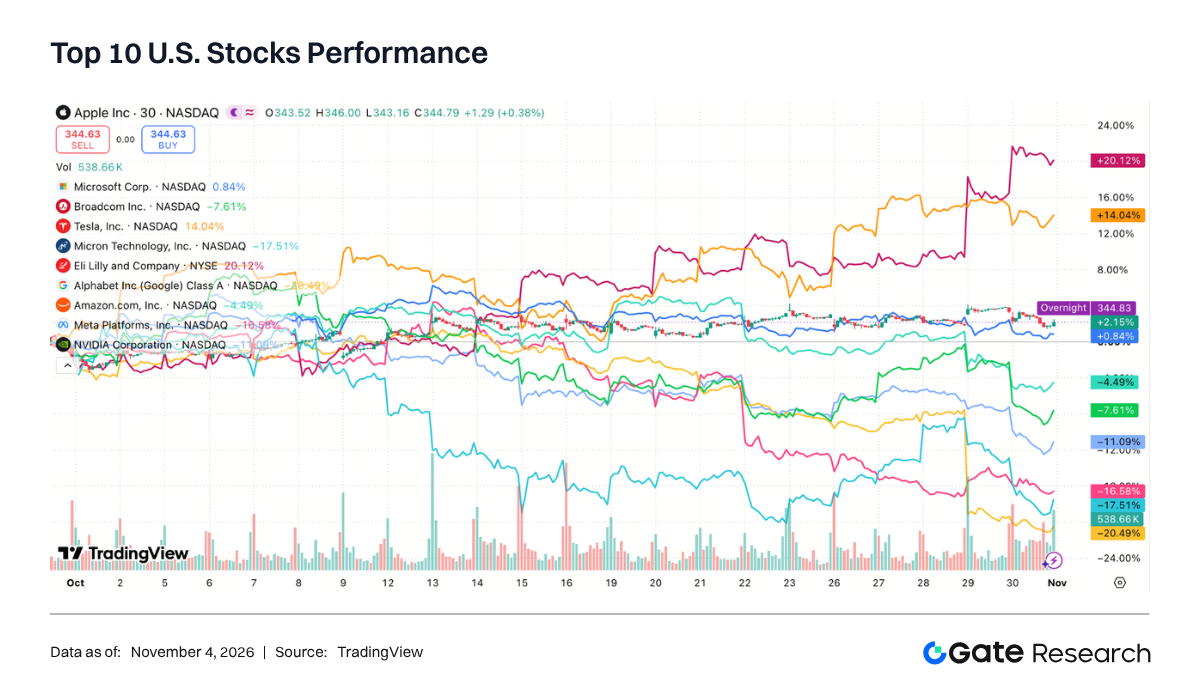
Technology stocks bore the brunt of this adjustment. On October’s final trading day, the Nasdaq Composite fell approximately 2.9% and the S&P 500 declined about 1.8%. Intel fell roughly 28.6% in a single session after its earnings outlook missed expectations, intensifying selling pressure across semiconductors. Market focus on AI infrastructure investment gradually shifted from the scale of capex toward returns on investment. Some mega-cap technology companies continued to increase spending on data centers, compute, and chip procurement, but investors began questioning whether this spending could generate sufficient revenue growth in the near term. The Nasdaq Composite recorded its worst monthly performance since March 2025, reflecting the start of a valuation rebalancing in the previously highly concentrated AI trade.
By contrast, the Dow remained positive, indicating that capital did not fully exit equities but instead rotated across sectors. Supported by rising crude prices, energy became one of the S&P 500’s strongest-performing sectors. Communication services faced clear pressure from higher investment spending by mega-cap technology companies and uncertainty over earnings expectations and capital returns. Compared with technology companies highly reliant on future earnings expectations, some traditional and defensive businesses had more visible cash flows and operating foundations, making them more likely to attract allocation capital.
Overseas markets were also affected by the global tech-stock adjustment and changes in rate conditions. Semiconductor and heavyweight technology stocks in Asian markets such as Japan and Korea faced substantial pressure at month-end, reflecting strong cross-market transmission of valuation adjustments across the global AI supply chain. European markets were affected simultaneously by energy costs, funding conditions, and growth expectations, with overall risk appetite remaining cautious.
For crypto markets, October’s adjustment in US technology stocks was broadly consistent with outflows from BTC and ETH ETFs. Institutions had previously favored mega-cap technology and major crypto assets, but as the AI trade became more crowded and technology earnings expectations were challenged, pressure to reallocate capital within risk assets increased. Meanwhile, traditional and energy sectors attracted capital, indicating that investors preferred reducing exposure to high-valuation assets rather than expanding risk investment across the board.
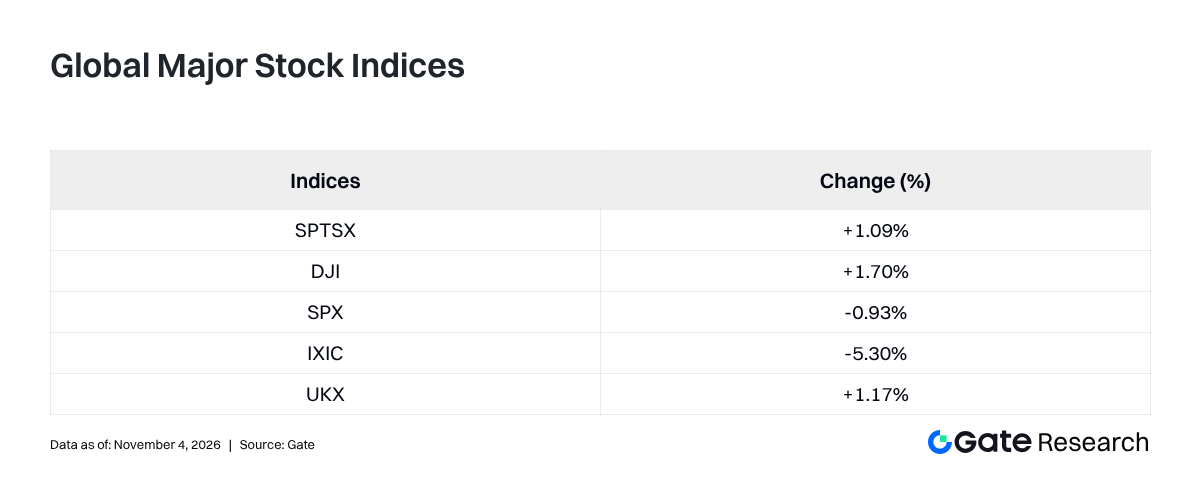
Overall, global risk assets shifted from a tech-led structure toward relative outperformance by traditional and defensive sectors in October. The Fed’s pause did not meaningfully lift technology stocks, while expectations for AI capex returns and corporate earnings performance became new pricing variables. For crypto markets, valuation adjustments in traditional risk assets and ETF redemptions jointly reflected declining institutional risk appetite. Near-term markets still needed to await renewed stability in technology earnings, macro liquidity, and capital allocations.
1.3.2 Equities: AI Capex Returns Drive Repricing as Mega-Cap Tech Performance Diverges
In October 2026, trading logic in US technology stocks shifted from AI investment expansion toward commercialization returns and capital efficiency, with clear divergence among mega-cap technology companies. Unlike the earlier focus on the scale of investment in GPUs, data centers, and cloud infrastructure, October’s earnings season prompted investors to place greater weight on whether AI-related capex could translate into actual revenue, margins, and free cash flow. As mega-cap technology companies reported earnings and future investment guidance, markets began reassessing the payback cycle for AI infrastructure spending. Technology stocks shifted from their previously highly concentrated rally into a clear adjustment.
Intel became an important catalyst for the month-end semiconductor adjustment. On October 30, Intel fell approximately 28.6% in a single session after its earnings outlook missed market expectations, marking a particularly pronounced one-day decline in recent years. Expectations for future revenue and profit improvement were shaken, further intensifying semiconductor selling pressure. The Philadelphia Semiconductor Index fell more than 7% that day, indicating that even as demand for AI compute continued to grow, investors were beginning to distinguish companies with clear orders and earnings-delivery capabilities from those reliant on expectations of future industry expansion.
Earnings from large cloud providers also became a market focus. As Alphabet, Amazon, and others reported results, investors demanded greater scrutiny of the scale of AI-related investment and its payback cycles. Although cloud and AI services continued to grow, markets began focusing on capex pressure from data-center construction, chip procurement, and energy consumption. Previously, high capex had been seen as necessary to capture AI market share. Under high rates, however, whether this spending could convert promptly into revenue and free cash flow increasingly became an important basis for sustaining valuations.
In terms of sector performance, technology and communication services faced clear pressure in October, while energy, financials, and some defensive sectors outperformed. Energy became one of the S&P 500’s strongest-performing sectors, while communication services ranked among the weaker performers. Markets did not reject AI’s long-term industrial value; rather, they began shifting from simply chasing capex growth toward selecting companies with commercialization capabilities, cash flow, and earnings quality.
For the crypto industry, the AI tech-stock adjustment had implications for the transmission of risk appetite. Although AI-related equities and risk assets such as BTC have different fundamental drivers, both are higher-volatility asset classes within institutional portfolios. When technology valuations compress and institutions reduce high-risk exposure, crypto assets can also face pressure from reduced allocation capital. BTC and ETH ETF flows both turned negative in October, jointly reflecting a temporary contraction in institutional risk appetite alongside the concentrated technology selloff.
Overall, the AI trade entered a new validation phase in October. Compute demand remained a long-term industry trend, but the scale of corporate capex was no longer sufficient on its own to drive share-price gains. Markets placed greater weight on AI revenue contribution, returns on investment, and free cash flow. Valuation divergence within technology is expected to persist: companies able to convert AI investment into sustained earnings will receive greater market recognition, while those lacking a clear commercialization path will face greater valuation pressure.
1.3.3 Gold: Profit-Taking at Elevated Levels and Real-Rate Pressure Push Prices Below $4,000
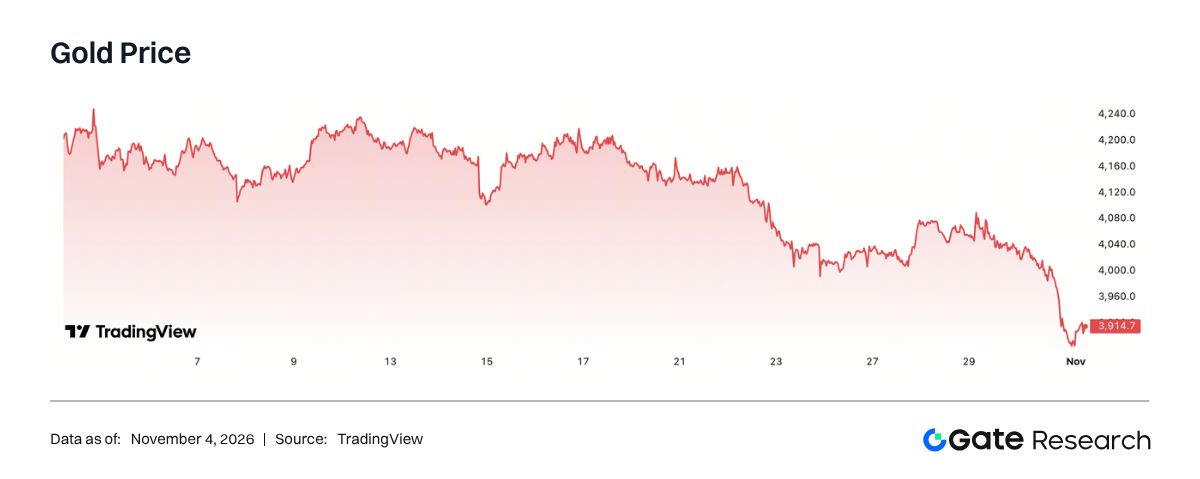
In October 2026, gold saw a clear adjustment, ending the strong rally previously driven by central-bank buying, ETF inflows, and geopolitical safe-haven demand. COMEX gold futures remained above $4,200 per ounce at the start of October but subsequently declined steadily, closing at $3,898.90 on October 30. Prices broke below $4,000 and recorded their lowest settlement since October 2025. Based on monthly market reporting, gold fell nearly 10% during the month, becoming one of the weaker-performing major global safe-haven assets.
Gold’s adjustment was initially related to accumulated gains from the preceding rally. Over prior months, central-bank buying, global gold ETF inflows, and geopolitical uncertainty had jointly driven sustained gains, clearly increasing gold’s allocation weight in global portfolios. With prices at historical highs, some investors began realizing gains. When liquidity contracts or risk assets correct together, gold may also be sold to replenish cash and reduce overall portfolio volatility. Its safe-haven attributes do not mean its price can rise independently in every market environment.
Monetary policy and dollar moves added further pressure on gold. Although the Fed held rates unchanged on October 28, core PCE inflation remained above target and economic growth remained resilient, limiting expectations for near-term rate cuts. The 10-year US Treasury yield fell from approximately 5.29% at end-September to 4.93% at end-October but remained elevated overall. High rates increased the opportunity cost of holding non-yielding gold, making it difficult for prices to sustain gains on geopolitical safe-haven demand alone.
Notably, gold did not fully perform its safe-haven role during October’s technology selloff. On October 30, US technology stocks fell sharply, while gold futures declined approximately 3.3% and spot gold briefly dropped to $3,880.97 per ounce. This pattern suggests that market liquidity needs and portfolio margin pressure may have prompted some investors to sell gold to replenish cash. Meanwhile, higher energy prices intensified inflation concerns and led markets to reassess the possibility of further monetary tightening.
From a macro asset-allocation perspective, the relationships between gold, the dollar, Treasury yields, and risk assets became more complex in October. Higher energy prices increased demand for inflation hedges, but high rates constrained gold’s upside. Risk aversion triggered by the technology selloff also did not fully translate into gold buying. Markets began shifting from a singular geopolitical safe-haven trade toward assessing real rates, dollar liquidity, and portfolio positioning together.
Overall, October’s gold market featured a sharp price correction alongside short-term profit-taking. The break below $4,000 indicated that previously accumulated elevated valuations and long positions needed to be worked through, while central-bank and long-term institutional allocations remained an important foundation for medium- to long-term demand. Gold’s future direction will continue to be jointly affected by real rates, dollar moves, geopolitical risks, and global central-bank buying. In the near term, the market has shifted from a sustained uptrend into a more pronounced correction from elevated levels.
1.3.4 Commodities: Middle East Supply Risks Lift Crude Prices as Industrial Metals Face Adjustments in Growth Expectations
In October 2026, commodities continued to show clear divergence. Energy prices rose sharply on geopolitical supply risks, while industrial metals were affected by global growth expectations and declining risk appetite. Unlike September, when crude and copper both received some support, energy and industrial-metal pricing diverged in October. Crude prices again became an important variable for global inflation expectations, while industrial metals such as copper began reflecting demand pressure from high rates and uncertainty over returns on technology-sector investment.
Crude was one of October’s strongest-performing major commodities. Ongoing US–Iran conflict continued to disrupt Middle Eastern energy supplies, while rising shipping risks around the Strait of Hormuz led markets to price in a higher supply-risk premium again. On October 30, December Brent crude futures settled at $117.64 per barrel and November WTI crude futures settled at $104.12, posting monthly gains of approximately 13.6% and 15.2%, respectively. An attack on an oil tanker near the Strait of Hormuz on October 30 further reinforced concerns over energy-transport security, pushing crude prices to their highest since April.
The impact of higher energy prices was not limited to crude markets. Rising oil prices feed through to downstream costs via gasoline, transport, aviation, and petrochemical supply chains, increasing global inflation pressure. US CPI rose 0.6% month over month in September, including a 9.1% increase in gasoline prices, already reflecting the direct impact of energy costs on consumer prices. As the Northern Hemisphere gradually entered the peak winter energy-demand season, markets paid greater attention to Middle Eastern supply, crude transport, and refined-product inventories. For the Fed, persistently rising energy prices also meant disinflation could proceed more slowly, limiting the scope for monetary easing.
In industrial metals, copper ended its prior run of three consecutive monthly gains in October, affected during the month by US dollar rate conditions, declining global risk appetite, and adjustments in demand expectations. Markets had previously held high expectations for copper demand from data centers, power infrastructure, and AI compute construction. As technology stocks sold off together, however, investors began reassessing the sustainability of the related capex, placing some pressure on industrial metals from revised demand expectations.
However, copper’s near-term supply structure remained tight. LME cash copper maintained a premium over the three-month futures price, indicating that immediate spot supply remained limited. Some copper inventories had previously continued to flow toward the US, affecting available stocks in traditional consumption markets. This spot-supply structure provided some support for copper prices. October’s copper adjustment therefore primarily reflected changes in macro risk appetite and future demand expectations, rather than indicating that global copper supply had moved into a broad surplus. Future prices will still require monitoring manufacturing demand, power-infrastructure investment, and inventory changes at major exchanges together.
More broadly, October’s commodity-price divergence reflected distinct pricing dynamics between supply shocks and demand expectations. Crude was driven primarily by Middle East geopolitical risks and transport security, with price increases reflecting supply-side risk to a greater extent. Industrial metals such as copper were affected by global economic growth, technology-investment returns, and US dollar rate conditions, leaving prices under relative pressure. Rising energy prices alongside weaker industrial metals indicated that commodities had not entered a synchronized rally driven by broad-based global demand recovery.
Overall, the main change in October’s commodity landscape was that energy-supply risk regained pricing dominance, lifting crude prices sharply, while industrial metals were weighed down by declining risk appetite and revised demand expectations. Energy-driven inflation may further limit the Fed’s scope for rate cuts, while copper prices need renewed stability in global manufacturing demand and expectations for technology-infrastructure investment. For global risk assets, inflation pressure from rising energy prices and uncertainty over industrial demand will remain important macro variables.
2. Analysis of Key Market Segments
2.1 Prediction-Market Volume Hits a Record High as Short-Cycle Event Contracts Move the Industry Into High-Frequency Trading
In October, prediction-market trading activity continued to rise, with industry notional volume reaching a record high and short-cycle event contracts becoming an important incremental driver of market expansion. According to Artemis, prediction markets set consecutive volume records across several trading weeks in October, while major platforms such as Kalshi and Polymarket saw growth in both trading volume and open interest. Kalshi’s monthly notional volume approached $100 billion, a platform record, while weekly notional volume across the industry exceeded $27 billion. Unlike earlier growth driven primarily by major events such as the US presidential election and the World Cup, this expansion came more from high-frequency trading scenarios involving sports, short-term BTC price moves, and combination contracts. Prediction markets are evolving from event-driven trading platforms into trading infrastructure covering financial assets around the clock.
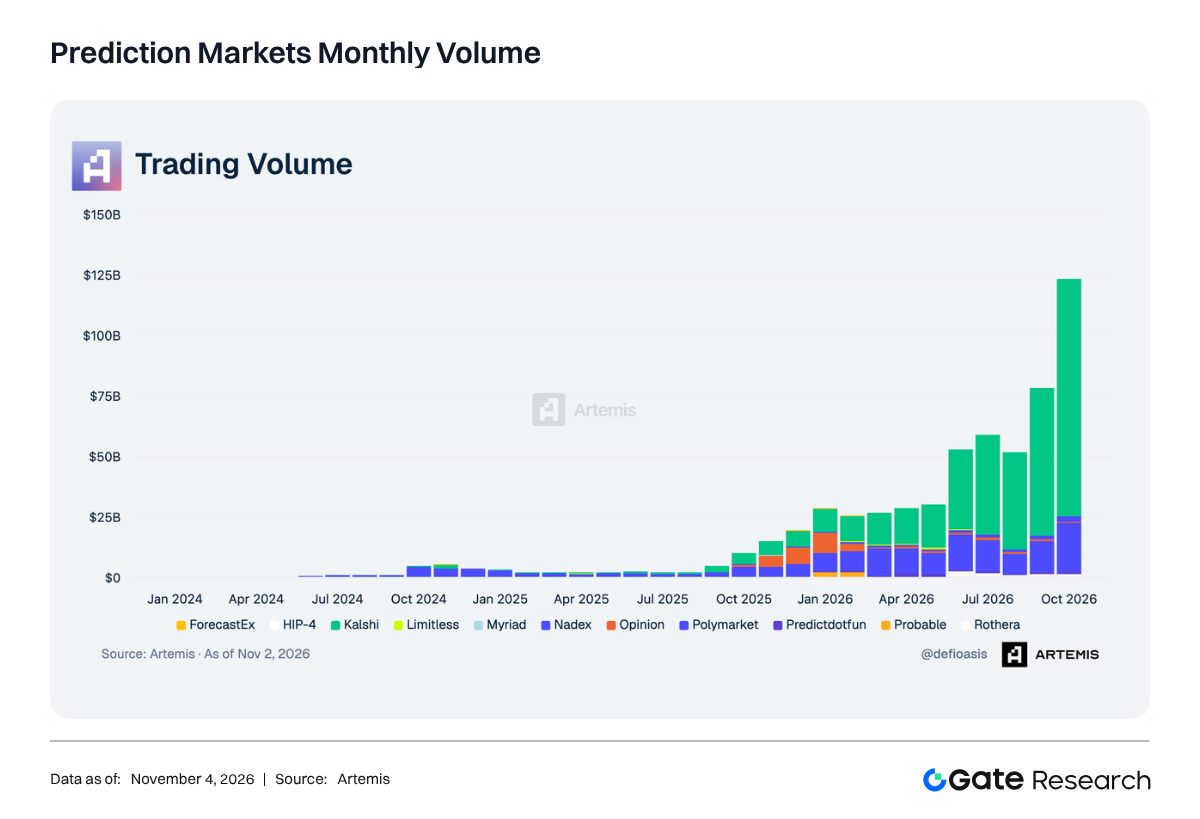
Short-cycle contracts are the most notable structural change in this round of volume growth. Traditional prediction markets mainly design contracts around events such as presidential elections, economic data, and sports results. Users typically hold positions for several hours to several weeks, with trading frequency constrained by event timing and the schedule for announcing outcomes. As products such as BTC 5min and 15min Up / Down become more widespread, users can directly trade the direction of BTC prices over the next few minutes. Contract settlement cycles have shortened substantially, while trading behavior has shifted from waiting for event outcomes to continuous participation in short-term price fluctuations. For platforms, short-cycle markets not only expand tradable hours but also increase individual users’ trading frequency and capital-turnover efficiency, allowing prediction markets to generate sustained trading demand even in periods without major macro events.
This trend is already reflected in the trading mix of major platforms. In late October, crypto-asset prediction contracts on Kalshi and Polymarket reached approximately $2.7 billion in single-week notional volume, a new high for the period, with short-cycle BTC Up / Down contracts contributing most of the incremental volume. Kalshi’s BTC contracts alone recorded more than $2 billion in weekly volume, with 15-minute Up / Down products becoming one of the most important trading categories. Notably, short-cycle trading is no longer confined to BTC. ETH, SOL, and other major crypto assets are gradually entering similar product frameworks, and prediction markets are beginning to directly absorb some of the short-term directional trading demand previously served by CEXs.
Alongside standalone short-cycle contracts, combination contracts (Combo) have also become an important product driving notional-volume expansion. Users can combine multiple event outcomes into a single position, for example simultaneously predicting a sports result, BTC price direction, and other events, with settlement determined by whether all conditions are met. These products are typically purchased at low contract prices, but generate larger notional volume when measured at contract face value. In October, Combo trading grew significantly on some platforms and overlapped with 15-minute BTC markets, further expanding prediction-market trading scenarios. Importantly, the notional volume of Combo contracts is not equivalent to the actual capital committed.
From a platform-competition perspective, industry growth is already showing clear segmentation. Kalshi has established a strong trading-scale advantage in sports, short-cycle financial contracts, and Combo products, with monthly notional volume approaching $100 billion in October and weekly volume exceeding $20 billion on multiple occasions. Its product mix is no longer confined to traditional political and economic events but continues to extend into financial assets such as BTC, gold, and equity indices. Polymarket continues to expand trading coverage through sports, politics, and crypto-asset markets, but faces more direct competition in short-cycle Up / Down markets such as 5min and 15min products. As user demand for immediate settlement and high-frequency trading increases, liquidity, trading costs, and quoting efficiency in short-cycle products are becoming important dimensions of platform competition.
Among on-chain prediction markets, Predict.fun’s growth further validated demand for short-cycle products. In October, the platform’s weekly fees reached approximately $2.2 million and exceeded $2 million for two consecutive weeks. Its BTC markets recorded more than $100 million in weekly notional volume for two consecutive weeks and contributed more than $1 million in fees each week. Total platform weekly notional volume again exceeded $200 million, while the weekly number of trades surpassed 1 million for the first time. Unlike platforms that rely on a single major event to attract traffic, Predict.fun mainly builds recurring trading demand through short-cycle markets such as BTC 5min and 15min products. Short-term Up / Down contracts contributed more than 60% of platform fee revenue. Meanwhile, the number of weekly trading addresses in football markets exceeded 25,000, and TradFi 15min markets gradually expanded to cover stocks such as NVDA, as well as gold and commodities, providing incremental markets beyond short-cycle crypto products.
The expansion of short-cycle products into TradFi assets is a direction worth watching in the next stage of prediction-market development. As BTC Up / Down contracts establish a relatively mature trading experience, platforms are beginning to replicate similar mechanisms for traditional financial assets such as stocks, ETFs, gold, and crude oil. Unlike traditional securities trading, Up / Down contracts do not require users to hold the underlying assets directly. Instead, they enable two-way trading around price changes within specified time windows, lowering the operational barriers to participating in different markets. In October, some platforms already supported 15-minute Up / Down contracts for more than 10 major stocks, as well as assets such as gold and crude oil, with trading hours aligned with the corresponding underlying markets’ opening hours. This gradually extends prediction-market product boundaries from traditional event outcomes to financial-asset price changes, creating overlap with CEXs, contracts for difference, and some derivatives-trading scenarios.
Participation by traditional financial institutions and market operators is also helping prediction markets develop into broader financial-information infrastructure. In October, S&P Dow Jones Indices partnered with Kalshi to launch event contracts linked to major indices and explore the use of prediction-market data to construct new index products. The NBA also established partnerships with major prediction-market platforms, promoting more standardized cooperation on sports-event contracts in areas such as event data, market access, and trading integrity. These partnerships show that prediction markets’ value is no longer confined to event trading among users. Their price and probability data are also becoming an information source of interest to traditional financial institutions and sports organizations.
Overall, October’s record prediction-market volume reflects a shift in the industry’s growth drivers. Sports and major events remain important sources of traffic, but short-cycle contracts such as 5min and 15min products are becoming a new growth engine by increasing trading frequency, shortening the time capital is tied up, and expanding the range of tradable assets. As short-cycle products extend into stocks, ETFs, indices, and commodities, the boundary between prediction markets and traditional derivatives trading will become increasingly blurred. Future industry competition will focus more on order-book depth, quoting efficiency, trading costs, settlement mechanisms, and asset coverage. Platforms that can provide sustained liquidity and establish reliable trading entry points are likely to gain greater market share.
2.2 Stablecoin Payments Accelerate Integration Into Traditional Payment Systems as Corporate Cross-Border Flows and Retail Access Expand
In October, the most notable shift in the stablecoin segment was not further growth in issuance, but deeper integration of payment capabilities into the actual business workflows of traditional financial institutions and trading platforms. Visa introduced stablecoin prefunding into its cross-border payout network; Gate integrated stablecoin balances into funding arrangements for card payments; and HSBC launched a Hong Kong dollar stablecoin through an existing retail application in Hong Kong. The OCC also finalized US payment-stablecoin rules during the month. Together, these developments indicate that stablecoins are evolving from settlement tools for crypto trading into underlying infrastructure for corporate fund transfers, cross-border payments, and retail purchases, although deployment remains concentrated in specific regions, customers, and use cases.
Payment-activity data provide more direct support for this trend. Allium’s adjusted figures as of September 30 show that stablecoin payments reached $482 billion year to date in 2026, up 45% year over year; payment counts reached 1.04 billion, up 71%, while stablecoin supply increased only 0.4% to $305 billion. Transaction counts grew faster than payment value, with the average payment falling from $544 to $462. This suggests incremental activity came not only from large on-chain capital transfers, but also from more frequent, smaller real-world payments.
Corporate use cases were the first entry point to achieve scale in this round of stablecoin-payment expansion. On October 1, Visa disclosed that about 17% of its stablecoin-linked card spending in fiscal 2026 to date came from business and commercial card programs. Visa supported more than 160 stablecoin-linked card programs, with associated payment value growing nearly 200% year over year. Although Visa’s data cannot represent the share of corporate payments across the entire stablecoin market, they partly indicate that stablecoins have begun entering corporate settlement, treasury management, cross-border payouts, and supplier payments through traditional payment networks.
On October 15, Visa Direct moved this trend from data into production deployment. Payment-infrastructure provider Inyo Global became the first integration partner to put Visa Direct’s stablecoin-prefunding capability into commercial production. Eligible customers could use USDC to prefund cross-border payouts in near real time rather than relying solely on traditional funding windows. The value of this arrangement is not that users directly replace bank-card purchases with stablecoins, but that remittance providers, fintech companies, and payment businesses can fund payout accounts more flexibly.
Trading platforms also began turning stablecoins from account balances into payment funds that can be mobilized across accounts. On October 7, Gate launched Gate Money, integrating fiat currencies, digital assets, stocks, payments, and wealth management within a single account framework. On October 8, Gate announced plans to launch crypto-linked cards with Visa in more than 40 countries and regions, with digital assets automatically converted into fiat at the point of payment. On October 12, Gate Card upgraded its automatic top-up feature: when the card balance is insufficient, funds can be drawn from Spot, Gate Money, Simple Earn, and stock accounts according to user-defined priorities, with both USDT and USDC available as funding sources in the first three account categories. This combination reduces the need for users to manually consolidate stablecoin balances before spending and connects stablecoins to existing card-payment networks.
Retail progress came from combining banks with established user channels. On October 23, HSBC’s first Hong Kong dollar stablecoin, RedCoin (RCHKD), officially launched on PayMe by HSBC. HSBC stated that over the following days, more than 3.3 million PayMe users would be able to activate an in-app stablecoin wallet for person-to-person transfers and payments to more than 100,000 merchants. Unlike wallets that only support on-chain deposits, conversion, or trading, RedCoin connects directly to the bank’s existing user accounts, payment application, and merchant network, forming a closed retail-payment loop spanning a regulated issuer, wallets, and merchant acceptance.
Regulatory progress provided a clearer compliance interface for expanding payment infrastructure. On October 21, the US Office of the Comptroller of the Currency (OCC) issued final rules implementing the GENIUS Act, covering payment-stablecoin issuance and related activities under its jurisdiction, including reserve assets, redemption, risk management, audits, reporting, custody, applications, and ongoing supervision. The rules will take effect on January 18, 2027, while provisions relating to the Bank Secrecy Act, anti-money laundering, and OFAC sanctions will be addressed in separate rulemaking with the US Treasury. This means October brought finalized rules and a clearer compliance path in the US market, rather than full implementation of all regulatory requirements and business-access arrangements during the month.
The competitive landscape for stablecoin payments is developing a layered structure. US dollar stablecoins remain an important foundation for cross-border liquidity and global settlement. Corporate clients focus more on fund availability, prefunding efficiency, redemption capacity, and system integration, while local-currency and bank-branded stablecoins are better positioned to build distribution channels through local licenses, retail applications, and merchant networks. Visa’s network integration, Gate’s multi-asset account–automatic funding–card payment flow, and HSBC’s closed-loop issuance represent three distinct paths. Visa focuses on embedding stablecoins into cross-border payment networks; Gate incorporates stablecoin balances into a trading platform’s funding arrangements for spending; and HSBC embeds regulated stablecoins into a bank’s local customer relationships and product suite.
The next phase of stablecoin payments still depends on operational capabilities rather than token supply alone. Corporate clients need reliable redemption and compliance arrangements; payment institutions need available liquidity and anti-fraud tools; and retail users need low-friction wallet activation, merchant acceptance, and clear consumer protection. None of these capabilities can be omitted. In cross-border use cases in particular, the speed of an on-chain transfer does not automatically translate into the speed at which funds reach the end recipient. Fiat conversion, customer identification, and local payout networks still determine the actual payment experience.
Overall, October was not the starting point for stablecoin payments, but a key milestone in their accelerated integration into traditional payment systems and deeper expansion into specific use cases. Visa Direct’s commercial prefunding, Gate’s automatic stablecoin funding and crypto-linked cards, RedCoin on PayMe, and finalized US rules respectively address corporate cross-border funding, trading-platform payment access, bank retail access, and compliance frameworks. Key indicators to monitor include activated wallets and actual merchant transaction volume, capital-turnover efficiency in cross-border payouts, sustained usage by institutional clients, and whether stablecoin issuers can simultaneously meet reserve, redemption, compliance, and local-distribution requirements across jurisdictions. Only platforms that can integrate these elements into an everyday payment experience are likely to build a lasting advantage in stablecoin payments.
2.3 DTS Broadens the Meaning of Tokenized US Equities: On-Chain Securities Entitlements, Full Shareholder-Rights Mapping, and Economic Exposure Diverge
In October, the Depository Trust Company (DTC), a DTCC subsidiary, officially launched the DTCC Tokenization Service (DTS). As a result, tokenized US equities no longer refer only to trading-platform products that give users exposure to stock prices; the term can also describe infrastructure through which a regulated depository system converts existing securities entitlements into on-chain records. Meanwhile, OKXICE sought to pass through rights equivalent to those of traditional stocks for tokenized US National Market System (NMS) stocks under a temporary exemption from the US Securities and Exchange Commission (SEC). Gate gStocks, by contrast, uses one-to-one reserves of actual stocks to provide equity economic exposure oriented more toward trading and fund management. All three structures involve equity tokenization, but differ in the rights they carry, control over their records, and interfaces with issuers.
DTS represents institutional-grade tokenization of securities entitlements. It allows DTC participants to transfer book-entry securities entitlements from their accounts into DTC’s Digital Omnibus Account, after which DTC mints corresponding tokenized entitlements and delivers them to registered wallets. DTC’s LedgerScan continues to maintain the official records of those entitlements and their on-chain movements. Initially eligible assets include Russell 1,000 constituents, ETFs tracking major indices, and US Treasuries—not all US equities. Before DTS launched, DTCC completed limited-scale production transactions with more than 30 traditional financial and digital-market institutions, validating use cases including securities lending, delivery versus payment for US Treasury repos, and equity delivery versus payment. DTS therefore does not involve issuers directly registering stocks in end-user wallets, nor is it a retail stock-token market allowing unrestricted circulation among arbitrary addresses. Instead, it adds a controlled, convertible on-chain representation of securities entitlements within DTC’s existing indirect holding system.
This distinction determines DTS’s rights structure. DTCC stated that tokenized securities entitlements retain all rights, investor protections, and economic interests associated with traditional securities, with corporate actions handled in the same way as traditional book-entry entitlements. Under the initial arrangements, however, DTC remains the securities intermediary under Article 8 of the Uniform Commercial Code and the ultimate record-keeper; DTC participants remain the entitlement holders recognized by DTC. Even where participants register wallets for clients, DTC’s legal relationship with those wallets still runs through the participants. Some corporate actions can still be processed through existing off-chain workflows, with detokenization first where necessary. Tokenized entitlements can move between wallets within DTC 24/7 on a free-of-payment basis, but do not carry DTC end-of-day settlement or risk-collateral value. DTS’s advance lies in bringing the recording and controlled circulation of equity entitlements on-chain, not in eliminating traditional depository, registration, and clearing systems.
Unlike DTS, the SEC’s temporary Tokenized Securities Venue (TSV) exemption introduced on September 17 targets new venues that trade tokenized NMS stocks in permissioned automated market maker (AMM) liquidity pools. The framework does not permit synthetic tokens that provide only derivative price exposure as underlying instruments. For tokenized stocks eligible for TSV trading, venues must verify that holders receive the same rights and privileges as holders of traditional stocks of the same class. These include equivalent interests in the issuer, dividends, voting rights, a share of residual assets upon corporate liquidation, and free access to proxy materials and other issuer communications. These are not optional product features, but eligibility requirements under this regulatory pathway.
OKXICE illustrates the execution requirements of this full shareholder-rights mapping approach. Its October 30 public notice stated that OKXICE TSV would use permissioned Uniswap v4 AMM liquidity pools on XLayer to facilitate trading between tokenized NMS stocks and payment stablecoins. Before listing an asset, OKXICE would review the tokenizer’s legal and contractual representations, one-to-one reserve attestations, and procedures for passing through dividends, proxy materials, voting instructions, and corporate actions such as stock splits and mergers and acquisitions. If these rights cease to meet the requirements, OKXICE will stop offering trading in the asset. OKXICE merely submitted written notice to the SEC on October 4 that it would operate under the exemption; this does not mean its products or the contents of its notice received individual SEC approval.
For this reason, issuer objections became a central variable in the OKXICE model. For NMS stocks tokenized by a third party unaffiliated with the issuer, a TSV must first send written notice to the issuer and wait at least 30 calendar days after receipt before allowing trading. If the issuer objects in writing within that period, the TSV cannot list the relevant asset. The SEC established this mechanism to allow issuers to assess potential benefits and risks, including the effect of on-chain transfers on shareholder-register maintenance and the risk that AMM prices, determined solely by the ratio of assets in a pool, may diverge from the spot market. On October 19, OKXICE’s public list already included 16 objecting issuers, including Microsoft, Goldman Sachs, and Alphabet; the number rose to 33 on October 27 and 50 by October 30. Most companies have not publicly disclosed specific reasons for their objections. Applied Optoelectronics (AAOI) was one of the few that did: according to The Wall Street Journal, the company was uncertain about tokenization’s effects on its stock price, liquidity, and volatility, and was concerned that investors might mistake unendorsed third-party tokens for company products.
Gate gStocks represents a third product model: actual stocks serve as the reserve anchor, while user positions are defined as equity economic exposure within the platform. Gate’s October product materials stated that gStocks uses fully backed one-to-one reserves of actual stocks, platform order-book matching, 24/7 trading, and a minimum investment of 1 USDT. Alpaca’s partnership announcement confirmed that its brokerage infrastructure supports custody and settlement of the underlying stocks associated with gStocks. According to Gate’s October 27 disclosure, cumulative gStocks trading volume exceeded $8.4 billion, with more than $2.2 billion traded over the preceding 30 days, nearly 30,000 cumulative trading users, and 78 tradable assets.
The key boundary is that gStocks holders are not registered shareholders in traditional brokerage accounts. Gate explicitly states that holders have no voting or corporate-governance rights. The platform may settle the equivalent value of cash dividends in USDT under its own rules, but this constitutes the pass-through of economic benefits under the product arrangement, not direct exercise of shareholder rights against the issuer. DTS therefore handles securities entitlements within a regulated depository system; OKXICE seeks full pass-through of equivalent shareholder rights under its TSV framework; and gStocks focuses on tradable, fractionalized, and composable equity economic exposure within crypto trading accounts.
Overall, October reshaped not the question of whether stocks can be tokenized, but the standards by which markets distinguish tokenized US equities. DTS broadens the term’s meaning in institutional markets: a token can be a compliant digital representation of existing securities entitlements. OKXICE shows that trading third-party tokenized stocks on a new US on-chain venue requires simultaneous treatment of equivalent shareholder rights, corporate actions, and issuer objections. Gate gStocks demonstrates that trading platforms can offer users equity exposure backed by actual stock reserves without granting full shareholder rights.
3. Industry Developments
3.1 Global AI Stock Selloff: Nasdaq Falls Approximately 5.3% for the Month
3.1.1 From Earnings-Driven Trading to Valuation Stress Testing
In October 2026, global AI stocks experienced a pronounced, concentrated selloff. The Nasdaq Composite fell approximately 5.3% for the month, while the Nasdaq-100 declined by an even larger 6.6%, and a basket of mega-cap technology stocks that had previously posted substantial gains fell about 4.7%. Over the same period, however, the Dow Jones rose approximately 1.8% and the S&P 500 Equal Weight Index gained about 5.0%. This divergence indicates that markets had not shifted wholesale into a recession trade, but were actively reducing exposure to highly valued AI assets and rotating capital toward financials, industrials, small- and mid-cap stocks, and traditional value sectors.
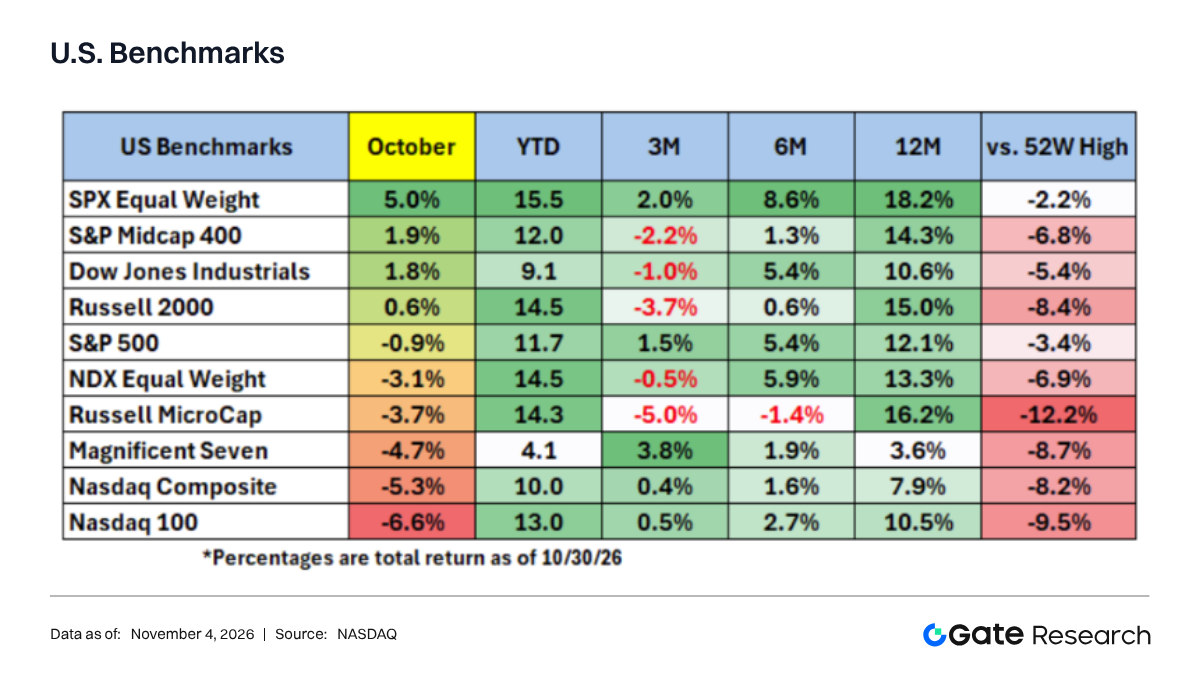
The core driver of the selloff was not a sudden rejection of AI’s long-term value by investors, but a reassessment of the relationship between capex, revenue growth, and free cash flow. Over the past two years, cloud-computing companies, chipmakers, and data-center operators have repeatedly increased AI infrastructure investment, but uncertainty remains over the speed at which compute investment can translate into software revenue, subscription revenue, and profits. As companies such as Meta and Microsoft continued to expand data-center spending, markets no longer focused solely on revenue growth, but also questioned depreciation expenses, funding costs, and whether free cash flow would come under pressure.
The October 22 selloff was representative: the Nasdaq fell approximately 2.6% in a single session, Meta declined about 7.0%, Nvidia dropped roughly 4.4%, and global equity indices weakened together. Pressure spread further at month-end, with the Nasdaq falling another approximately 2.9% in a single session and Intel declining 28.6%. This indicates that selling had evolved from simple profit-taking into a repricing of some companies’ earnings quality and the payback cycles of their AI investments.
3.1.2 The Adjustment May Not Be Over, but This Does Not Mean the AI Cycle Has Ended
This adjustment was also influenced by rate conditions. The rebound in US inflation made it difficult for long-term rates to decline rapidly, raising the discount rate applied to the future cash flows of highly valued growth stocks. Even without substantial downward revisions to corporate earnings forecasts, valuation multiples could still compress. Given the high weighting of AI stocks in the Nasdaq and global growth funds, quantitative position reductions, ETF redemptions, and options hedging could further amplify short-term volatility.
Assessing whether AI stocks are entering a longer-term bear market requires more than looking at index declines. First, it is necessary to monitor whether AI revenue at mega-cap technology companies can grow faster than capex. Second, free-cash-flow margins, depreciation expenses, and data-center utilization need to be monitored. Third, market breadth matters: if indices continue to decline but the number of advancing stocks gradually increases, this would indicate that capital is still rotating within the market rather than exiting equities across the board.
October’s market moves therefore more closely resembled a stress test of valuations and returns on investment. If AI-product revenue begins to materialize and long-term rates stabilize, high-quality leaders may be the first to recover. For companies that rely primarily on distant narratives, have weak cash flows, or depend heavily on external financing, however, the period in which merely announcing increased AI investment earned a valuation premium may already be over.
3.2 US CPI Rises to 3.7% as the Federal Reserve Ultimately Chooses to Pause Rate Hikes
3.2.1 Why the Inflation Rebound Did Not Immediately Trigger Another Rate Hike
US CPI rose 0.6% month over month in September, with year-over-year inflation increasing to 3.7%, above August’s 3.4%. Energy prices were an important source of this rebound, with gasoline prices rising particularly sharply. The data indicated that disinflation was not a linear process and that the Fed remained some distance from its 2% target, while also rapidly weakening market expectations for near-term rate cuts.
At its October 27–28 meeting, however, the Fed did not raise rates further, instead maintaining the federal funds target range at 3.75%–4.00%. The key to this decision was the central bank’s need to distinguish energy shocks from persistent demand-driven inflation. Oil and gasoline prices can rapidly push up headline CPI, but this does not necessarily mean that wages, housing, and core services prices are again becoming broadly unmanageable. If the Fed were to continue raising rates solely because of a single energy-driven increase in headline inflation, it could cause unnecessary demand contraction after energy prices declined.
Meanwhile, the Fed had already raised rates by 25 basis points to 3.75%–4.00% in September. Monetary-policy transmission through housing, corporate financing, and labor markets takes time, while rising long-dated US Treasury yields themselves also tighten financial conditions. October’s pause therefore more closely resembled an assessment of policy effects than a declaration that the task of fighting inflation was complete.
3.2.2 A Pause Does Not Mean a Pivot Toward Easing
For markets, the most likely misinterpretation is to equate a pause in rate hikes directly with the certainty that the next move will be a rate cut. In fact, with CPI having risen to 3.7%, the Fed has ample reason to keep rates in restrictive territory for longer. If inflation expectations rise, energy prices continue to feed through to transport and services prices, or wage growth accelerates again, the option of further rate hikes could return to the discussion.
This policy combination affects different assets differently. In the near term, a pause in rate hikes can ease the pressure for further increases in the dollar and short-term rates, providing some support for equities and crypto assets. Rising inflation, however, also limits the scope for valuation expansion. For AI stocks dependent on distant earnings, as well as Bitcoin and Ethereum, which are sensitive to global liquidity, higher rates for longer may matter more than a single rate hike.
Three indicators should be the focus of monitoring: first, core services inflation excluding energy and housing, to assess whether demand pressure remains persistent; second, wage growth and job openings, to confirm whether the labor market continues to cool; and third, the two-year US Treasury yield and breakeven inflation rates. If headline CPI declines as energy prices fall while core services inflation remains stable, the Fed is more likely to maintain its pause. Conversely, if inflation spreads to wages and services, October’s pause may prove to be only a brief interruption in the rate-hiking cycle.
3.3 Bitcoin and Ethereum ETFs See $2.16 Billion in Monthly Outflows: Has Institutional Demand Reversed?
3.3.1 Outflows Are Large, but Their Structure Matters More Than the Total
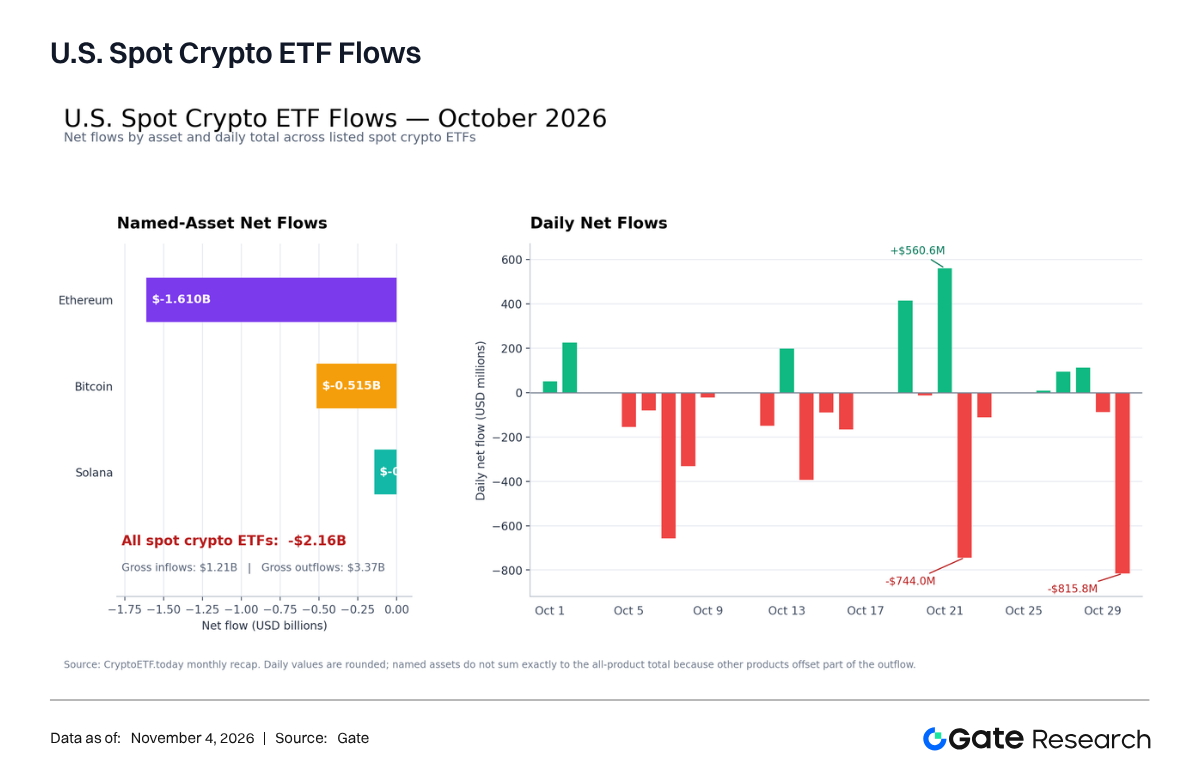
In October 2026, US spot crypto ETFs recorded approximately $2.16 billion in combined net outflows, with total inflows of about $1.21 billion and total outflows of roughly $3.37 billion. By asset, Ethereum ETFs saw approximately $1.61 billion in net outflows, accounting for the largest share of this round of capital withdrawals; Bitcoin ETFs recorded about $515 million in net outflows, while Solana ETFs saw roughly $144 million. Some other products recorded net inflows, so the outflow amounts by asset cannot simply be added together to arrive at the overall net outflow total.
The timing of flows was also uneven. On October 21, spot crypto ETFs still recorded approximately $561 million in net inflows, but this rapidly reversed to about $744 million in net outflows on October 22, followed by roughly $816 million in net outflows on October 30. Such sharp swings between positive and negative flows indicate that institutional capital did not leave the market continuously and in one direction throughout the month. Instead, institutions adjusted risk rapidly in response to macro data, technology-stock volatility, and security incidents in the crypto industry.
Ethereum’s outflows are particularly worth monitoring. In addition to ETH’s substantially larger price decline than Bitcoin during the month, spot ETFs cannot fully capture on-chain staking yields, reducing their appeal relative to direct token holdings and staking products. When market risk appetite declines, some investors face three pressures at once: falling prices, rising opportunity costs, and the absence of staking yields. Ethereum ETFs are therefore more likely to become targets for position reductions.
3.3.2 More Like Tactical Risk Reduction Than the Disappearance of Long-Term Demand
Whether institutional demand has reversed cannot be determined solely from one month of net outflows. ETF capital includes not only long-term asset allocations, but also basis trades, arbitrage, options hedging, and short-term trend strategies. When US Treasury yields rise, the Nasdaq falls, or crypto-asset volatility increases, quantitative and relative-value investors may rapidly redeem ETFs. This does not mean that pension funds, family offices, or wealth-management institutions have permanently abandoned digital assets.
The more reasonable conclusion at present is therefore that institutional demand has undergone a clear tactical contraction, but the evidence remains insufficient to confirm a long-term reversal. A genuine structural reversal would typically require several developments to occur together: sustained net outflows over several weeks, a decline in ETFs’ share of total asset value, a persistently negative CME futures basis, shrinking spot-market volume, and continued reluctance by capital to return even when prices rebound.
Over the coming weeks, if Bitcoin ETFs return to net inflows first while Ethereum ETFs continue to see outflows, this would indicate that institutions are not exiting crypto assets but are raising their requirements for liquidity and security within the asset class. Only if ETF categories record sustained simultaneous outflows while equity-market risk appetite continues to decline would this need to be viewed as a broader shift in asset allocation.
Data Source:
- Dune, https://dune.com/near/near-intents
- Dune, https://dune.com/defioasis/arc
- Gate, gate.com/announcements/article/51452
- CoinGecko, https://www.coingecko.com/research/publications/rwa-report-2026
- Investing, https://www.investing.com/indices/us-30-futures-chart?cid=1175152
- Coinmarketcap, https://coinmarketcap.com/etf/
- Tradingview, https://www.tradingview.com/markets/indices/quotes-major/
- Cryptoetf, https://cryptoetf.today/en/news/crypto-etf-monthly-recap-2026-10
- Federalreserve, https://www.federalreserve.gov/monetarypolicy/fomcpresconf20261028.htm
- Nasdaq, https://www.nasdaq.com/articles/october-2026-review-and-outlook
Gate Research is a comprehensive blockchain and cryptocurrency research platform that provides deep content for readers, including technical analysis, market insights, industry research, trend forecasting, and macroeconomic policy analysis.
Disclaimer
Investing in cryptocurrency markets involves high risk. Users are advised to conduct their own research and fully understand the nature of the assets and products before making any investment decisions. Gate is not responsible for any losses or damages arising from such decisions.